Product Navigation
Brewing beer with Pica Photometry System
Using Pica to monitor fermentationAlshain Pica is an easy yet powerful tool for using optical backscattering in monitoring bioprocesses such as yeast-based fermentations. Backscattering measurements are non-invasive (essentially contamination risk free) because they are done through side of a transparent vessel or through a window in a tank. Pica sensors are designed to be mounted on exisiting flasks and tanks to make the system more cost-efficient.
Benefits:
- Detect immediately if yeast stops to grow or behaves unexpectedly
- No unnecessary delays due to manual sampling
- Comparing batches to ensure repeatability
- Estimate total carbohydrates (sugars etc.) in liquid
- Easy to use, from box to measurements in less than 5 minutes
For more information about Pica Photometry System, see:
- Pica product page
- Pica Brewer's Kit and Pica Brewer's Kit plus (for measuring carbohydrates)
- Brief introduction to backscattering measurements
- Tutorial: Simple batch fermentation
- Alshain Pica oluen valmistamisen apuna (same article in Finnish)
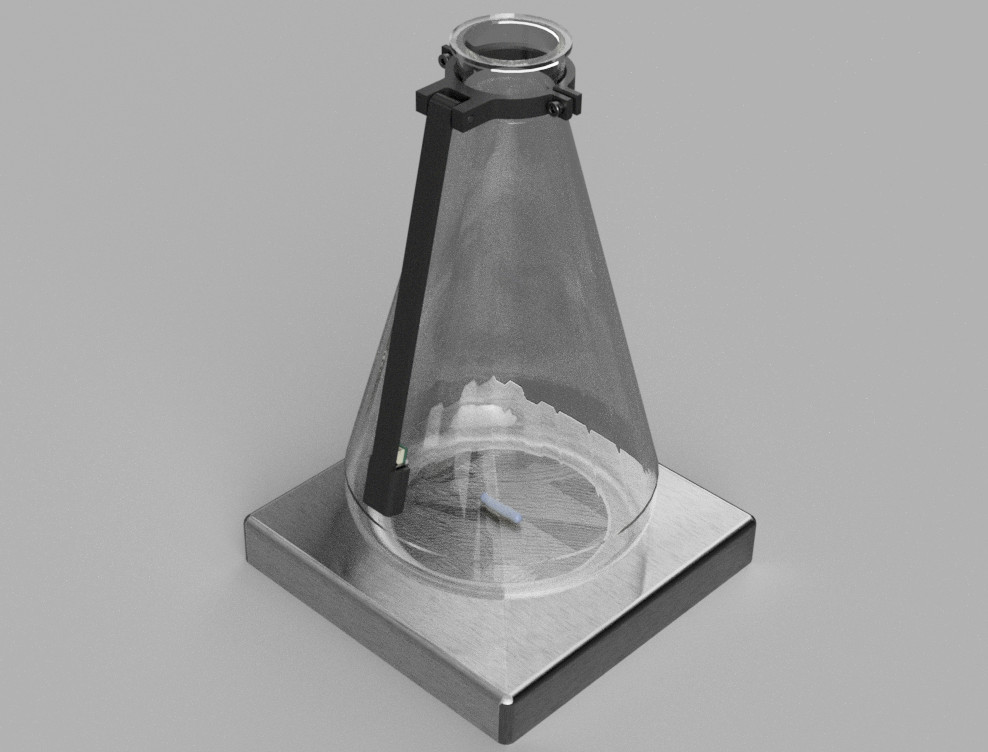
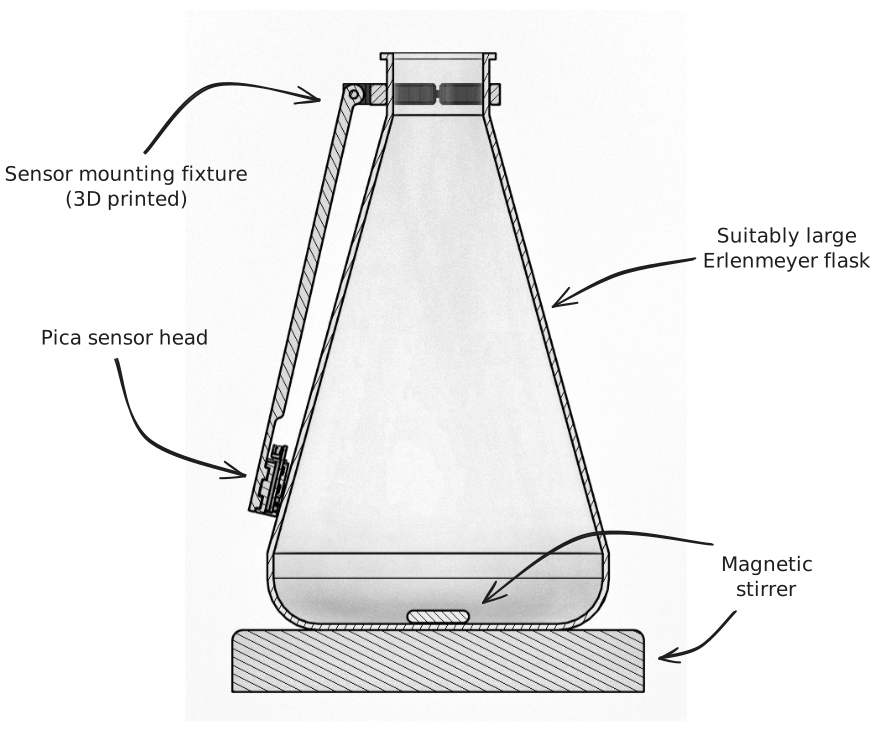
Example setup
All measurements in this article have been done using an Erlenmeyer flask with a magnetic stirrer.
These measurements can also be done using other glassware or setups such as a transparent containers or tanks/reactors with a window.
Main requirement is that backscattering measurements need an unobstructed view of the liquid.
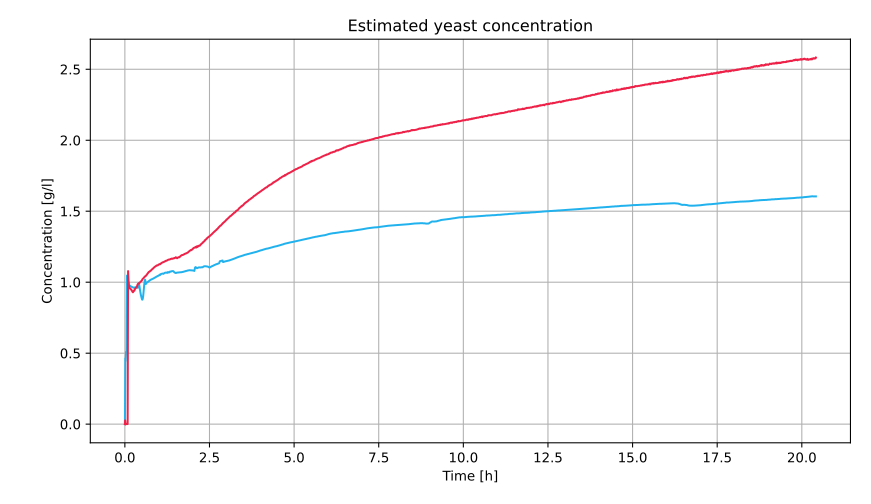
Yeast growth curves
Comparison of two yeast cultivations using same recipe (amount of nutrients, temperatures, initial yeast amount etc.), one successful and one with bad yeast cell viability (figure above).
Monitoring yeast growth in real time gives ability to quickly detect changes in the process (and acting on them), to have a broader understanding of growth dynamics and having tools to aid in product development.
Examples:
- Continuous growth rate and cell density monitoring (is cell density suitable for pitching etc.)
- Detecting when growth stops or if it stalls at some point
- Comparing curves between batches
- Process optimisation
- Quality assurance
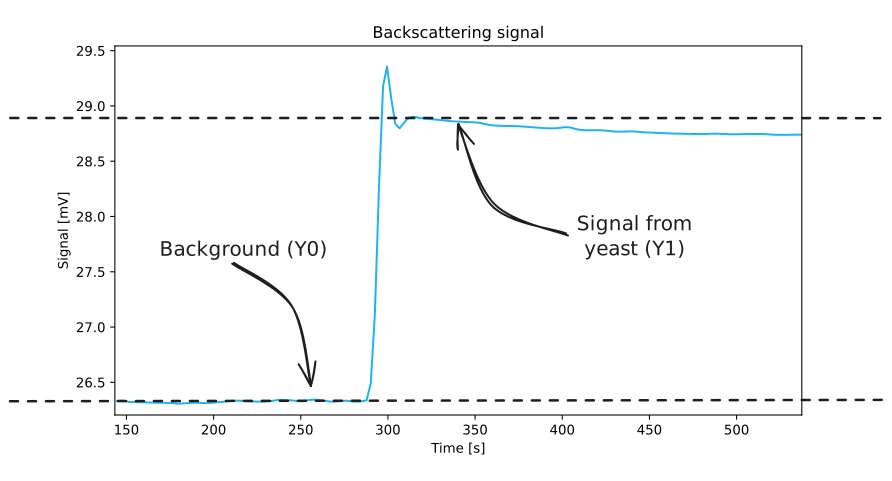
Calibrating growth curves
Backscattering signal is linearily related to density of scatteres such as cells meaning that relative changes in signal corresponds to similar changes in density of cells in the liquid.
This makes calibration simple as it can be done without any extra equipment.
Steps:
- Start measuring before adding the yeast to determine the background signal
- Add a know amount of yeast (note: sensor measures cell density, not absolute amount)
- Take note how much signal increases from the yeast
Converting signal into yeast concentration: C(t) = (Signal - Y0)/(Y1 - Y0) * C0, where:
- C(t) = yeast concentration
- Signal = measured value from Pica photometer
- Y0 = background signal value before yeast
- Y1 = signal just after adding the yeast
- C0 = how much yeast was added (amount of yeast per volume)
Measuring carbohydrates
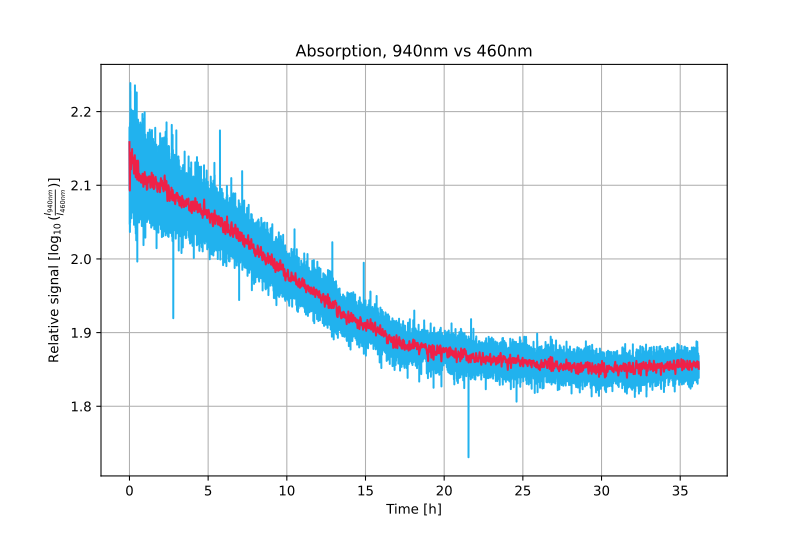
Standard Pica sensor head uses near-infrared light to detect cells and is unaffected by the colour of the liquid or presense of most of biochemical compounds such as sugars. Adding a second sensor head (with 460nm wavelength i.e. blue) opens up possibility to estimate the amount of carbohydrates in the liquid as many organic compounds have parts of their spectral absorption lines in 430nm - 490nm range. These are for example:
- Starches, dextrins
- Sugars (fermentable and non-fermentable)
- Some simple sugars have their absorption lines deep in the ultraviolet and are not detected
- Other compounds like carotenoids and chlorophyll
Measurements are done by measuring backscattering at both wavelengths (near-infrared and blue) and comparing results as yeast cells reflect both but the blue light is attenuated by the carbohydrates (and other similar compounds). Comparing signals to each other gives an estimate on how much blue light is absorbed by the liquid and therefore the amount of carbohydrates present.
Interfacing two sensor heads with one Pica Readout requires a signal multiplexer, available at Alshain Store.
Carbohydrate curves can be used also without calibration to determine when yeast stops consuming sugars etc.
Calibrating carbohydrate curves
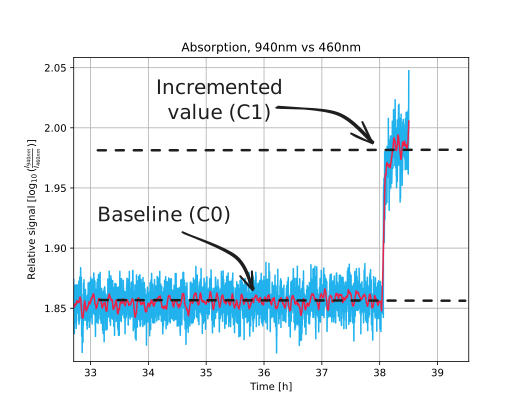
Carbohydrate concentration estimates can be calibrated similarly to the yeast growth curves with some caveats. Unlike the growth curves, carbohydrate estimates require that the liquid already has scatteres (i.e. yeast cells) in it so that a proper signal can be acquired from both sensors.
Steps:
- Prepare a solution (this can contain most of the malt extract and sugars needed)
- Measure the background signal from sensors
- Using the yeast, do the growth curve calibration for both sensors simultaneously
- Measure baseline relative signal using both sensors (applying the calibration from previous step to remove background etc.)
- Add a known amount of malt extract to the liquid
- Measure increase in the signal
In contrast with the yeast growth curve, carbohydrate estimates have an extra constant called system offset which arises from measurement environment and sensor physics.
Equations:
Q(t) = log10( I940nm / I460nm)
- Q(t) = relative signal from sensors (absorption is logarithmic, hence base-10 logarithm in the equation)
- I940nm = calibrated signal from 940nm sensor head
- I460nm = calibrated signal from 460nm sensor head
Cch(t) = (Q(t)-C0) / (C1-C0) + S0 + Ssys
- Cch(t) = estimated amount of carbohydrate
- Q(t) = relative signal from the sensors (see previous equation)
- C0 = baseline relative signal
- C1 = relative signal after known amount of malt extract is added
- S0 = inital amount of carbohydrates in the liquid (i.e. at the start)
- Ssys = system offset
See also
Links
- Pica Photometry System (for real-time biomass monitoring)
- Brief introduction to backscattering measurements
- Browser-based user interface for Pica
- OD600 (definition of optical density used in biochemistry)