Product Navigation
Measuring biomass using optical backscattering
A brief introduction to biomass monitoring and backscattering measurementsDuring fermentation and cultivation of cells such as bacteria, yeast and algae, monitoring changes in biomass density is very important as it provides information about the growth and overall health of the cell cultures.
Monitoring biomass can be used to assist controlling the process, optimising parameters for growth and analysing and validating cultivation strategies.
Biomass monitoring produces a growth curve, i.e. how much has biomass concentration changed as function of time. There are multiple methods for measuring biomass concentration, both optical and mechanical, optical methods being far more prevalent. Optical methods are also readily suited for real-time measurements.

Growth curves
There are usually four sections or phases in a growth curve:
- Inoculation: Cells ( bacteria, yeast etc. ) are introduced to the reactor
- Lag phase: Cells adapt to their new environment before starting to multiply
- Growth phase: Number of cells increases rapidly ( also called log phase )
- Stationary phase: Growth is limited by lack of resources
These curves are used to model system behaviour and to estimate parameters such as specific growth rate (µ) and doubling time (td).
Measurement methods
Three most common methods for optically measuring biomass density are:
- Standard manual sampling
- Sample is taken from the bioreactor and optical density is measured using a desktop spectrophotometer (transmission measurement)
- Sampling consumes a small amount of growth medium and cells (an issue if cultivation volume is small)
- Frequent sampling poses an increased contamination risk
- Real-time transmission measurement
- Rod-like sensor (optical measurement done at the tip of the rod) is installed into reactor vessel
- Suitable only for larger reactors and vessels
- Backscattering measurement
- Uses light that is reflected (or more precisely, scattered back) from the cells
- No risk of contamination as the sensor is not in contact with the growth medium
- Requires calibration to provide OD600 readings comparable with manual sampling method
Backscattering measurement
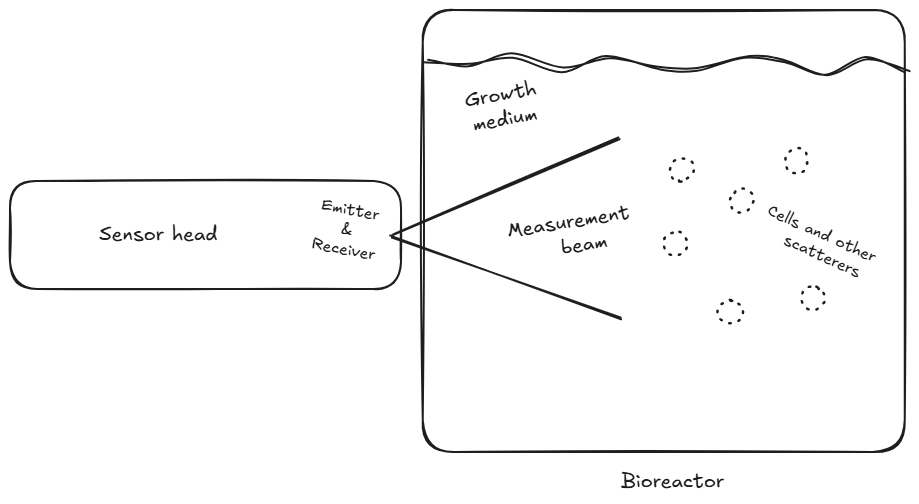
In a backscattering measurement, a beam of light is emitted into the liquid containing cells. As light interacts with the cells, a small amount is scattered back to the sensor. Intensity of this backscattered light is related to the number of scatterers in the beam ie. density of cells in the media.
- Simpler geometry than with transmission where measured target must be between emitter and receiver
- Receiver and emitter are next to each other and facing same direction
- Sensor can be installed to side of a transparent vessel or to a window
- Fast measurements
- Multiple measurement per second
- High time resolution can be used to monitor system dynamics
- More frequent sampling is useful for data analysis
- Dynamic range is very large, same sensor can be used to measure from near-transparent to high optical densities
- Linearity of the sensor and rejection of ambient light is crucial
- Unlike in transmission measurements where light is attenuated logarithmically, backscattering signal almost linear as optical density increases
To minimise unwanted effects caused by ambient light, a pulsed or chopped measurement is commonly used:
- Signal is sampled at multiple points during a measurement pulse to remove ambient light contributions
- Frequency of pulses is high enough so that even fast changes in prevalent lighting conditions are cancelled out
- Statistical methods or time-domain filters are then applied to the signal, providing a more stable result
Contributing factors
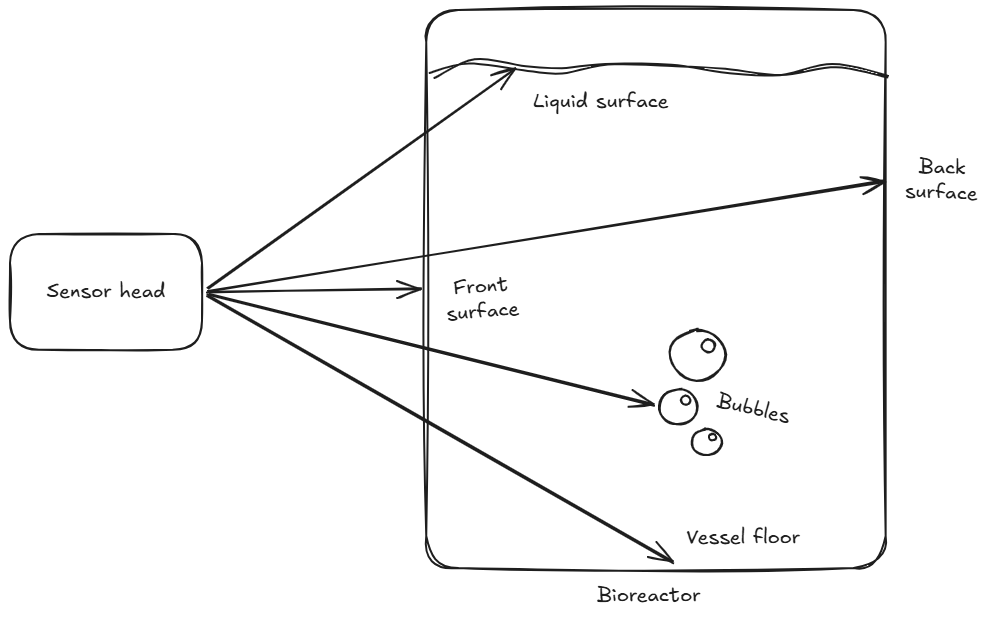
Measured signal consists of reflections from the cells and environment:
- Front surface (window / vessel surface), depends on the haziness of the window or surface
- Liquid surface, if measurement beam reaches the surface of the medium
- Back (or opposite) surface of the reactor vessel
- Vessel floor, if visible to sensor
- Other structures (stirrers, tubing etc.)
Larger vessel and higher optical densities reduce the effects of static structures, as light reaching and reflecting off of them spreads out more and is absorbed by the medium.
Note: Small vessel and very transparent liquid (i.e. optically thin scenario) is more challenging for backscattering measurements.

Signal components
- Imeas = Measured signal (i.e. light reflected back to sensor)
- Iemit( A, T ) = Intensity of light emitted from sensor head
- A = Target amplitude of light
- T = Temperature at sensor head, higher temperatures yield less intensity
- Gwindow = Window or vessel surface transparency
- Y( ρs ) = Reflectance of scatterers (particles, cells etc.)
- ρs = Density of scatterers (cells per unit volume)
- Istatic = Reflections from static parts of the reactor (liquid surface, vessel floor, tubing, back surface)
- Ibubbles = Reflections from bubbles in the liquid
- Ifront = Reflected light from the window/vessel front surface
- enoise = Electrical noise
Note: Reflectance is not strictly linear due to multiple scattering, diffraction etc.
See also
Links
- Pica Photometry System (for real-time biomass monitoring)
- Beer-Lambert law (for transmission measurements)
- OD600 (definition of optical density used in biochemistry)