Product Navigation
Tutorial: Simple batch fermentation run
Introduction to Pica Photometry System
Disclaimer: This tutorial is only to illustrate how to use Pica Photometry System, not to provide proper protocols and methods for batch fermentation or other bioprocesses.
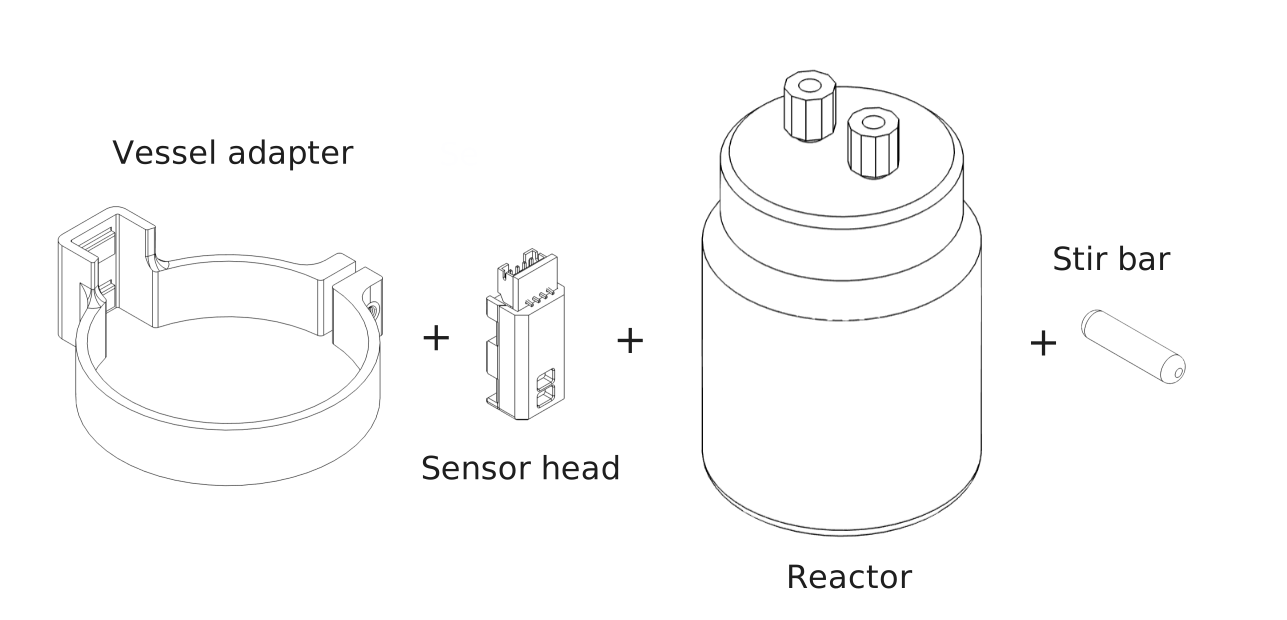
Equipment required
- Vessel adapter: Adapter suited for the reactor vessel, holds the sensor head in place
- Sensor head: Backscattering sensor to measure cell density
- Reactor: Vessel to hold the growth medium and cells
- Stir bar: Magnetic stirrer bar to provide mixing for liquid (+ magnetic stirrer base to spin it)
Also, a Pica Readout is needed to perform measurements using the sensor head and interfacing with host PC.
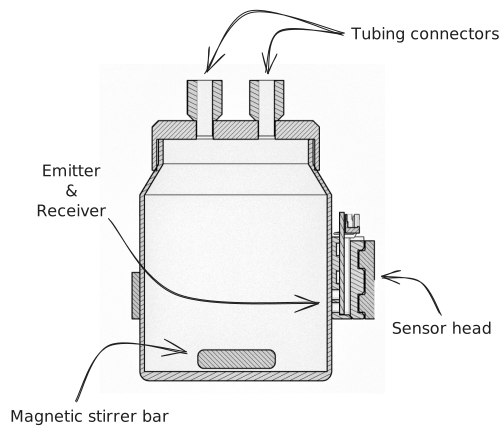
Assembled reactor
Besides the reactor itself, there are three crucial components:
- Sensor head
- Houses optical emitter and receiver used to perform biomass measurements
- Should be placed so that the beam has unobstructed view of the broth
- Tubing and connectors
- Filling the reactor with growth media and later inserting the inoculant
- As the growth medium fills the reactor, gasses (air) are displaced and must have a route to exit the reactor
- Magnetic stirring
- Stirring helps to keep the broth homogenous
- Reactor needs to be placed on top of a magnetic stirrer base in order get the stirrer rod to spin
- Speed of stirring should be adjusted so that vortex caused by stirring is not visible to sensor
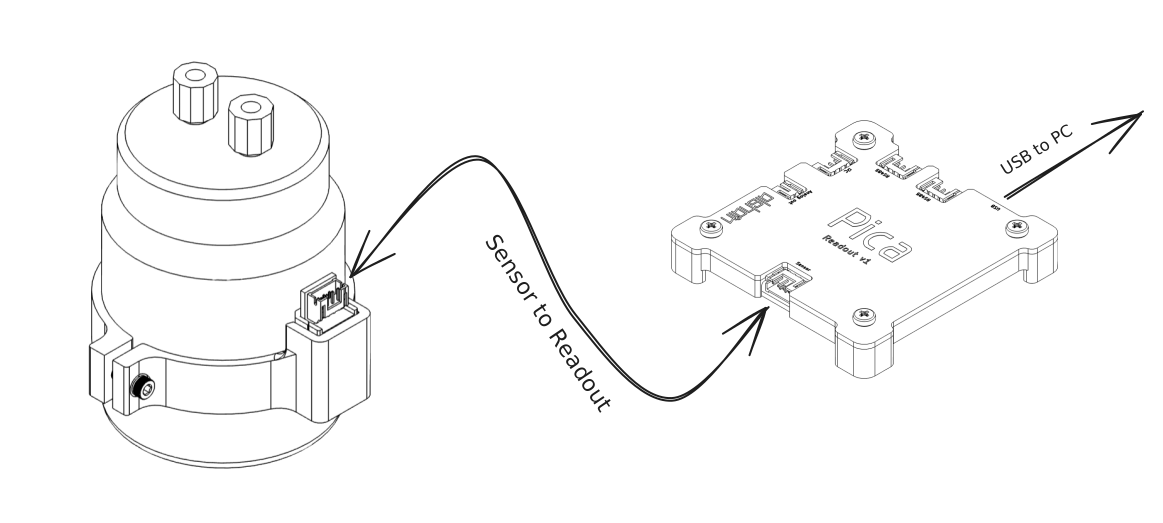
Connecting to Readout
- Sensor head to Readout
- Readout controls the sensor head using analog signaling
- Sensor can be installed to side of a transparent vessel or to a window
- Readout to PC
- Can be connected via USB or RS-485
- Computer sends commands to Pica Readout and queries measurement results
- Pica Readout acts as a virtual serial port, so there shouldn't be need for installing any drivers
Note: this tutorial provides Python examples, but a browser-based user interface is also available.
A Python script to check that the readout is working and connected to PC:
import alshain
import serial
import sys

# Serial port as first command line parameter
com = serial.Serial( sys.argv[1], alshain.BAUDRATE, timeout = 0.25 )

dev = alshain.Pica( com, address = 1 )

# Read firmware version (to test communication between PC and readout)
print( hex( dev.read( alshain.Pica.Parameters.FIRMWARE_VER ) ) )

com.close()
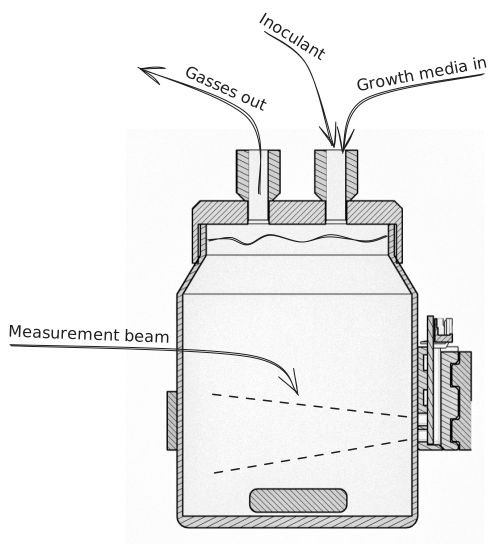
Starting the experiment
Steps:
- Fill the reactor with suitable growth media
- Start the mixing and adjust mixing speed
- Make sure that sensor head is positioned accordingly
- Start logging backscattering signal, so difference between pre- and post-inoculation can be measured
- Begin injecting the cells to reactor (inoculation)
- Monitor signal levels and inoculant mixing
A Python script to log backscattering signal continuously:
import alshain
import serial
import sys
import time

# Serial port as first command line parameter
com = serial.Serial( sys.argv[1], alshain.BAUDRATE, timeout = 0.25 )

dev = alshain.Pica( com, address = 1 )

# Enable photometer source
dev.write( alshain.Pica.Parameters.PULSE_ENABLE, 1 )

# Start time
t0 = time.time()

# Loop ends with ctrl-c
try:
   # Poll results every 500ms
   with open( "output.csv", 'w' ) as handle:
      while True:
         value = dev.read( alshain.Pica.Parameters.RESULT )
         t = time.time() - t0

         # Store to file
         print( t, result, file = handle )

         # Print to terminal
         print( t, result )

         # Wait for 0.5s
         time.sleep( 0.5 )
except KeyboardInterrupt:
   pass


com.close()
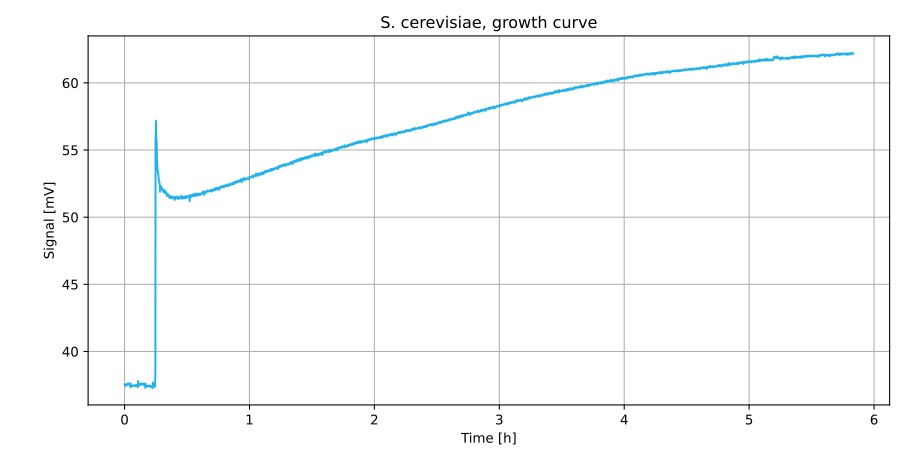
Measuring growth curve
Continue logging the backscattering signal
- Depending on the type of cells and amount of resources available, timescale ranges from hours to days
- Prominent features in the growth curve are:
- Inoculation, curve spikes up when cells are introduced to system
- Lag phase, cells adapt to their new environment, no growth
- Log phase, number of cells increases rapidly
- Stationary phase, growth slows down due to lack of resources
- Parameters such as specific growth rate (µ) can be estimated from the log phase
- Conversion from raw signal to more useful units (OD600, cell count etc.) requires calibration:
- OD600: offline measurements using manual sampling and fitting a linear model to signal
- Relative growth: backscattering signal is very close to linear regarding cell density, comparing measurements to signal change caused by inoculation gives a scale for relative growth
See also
Links
- Pica Photometry System (for real-time biomass monitoring)
- Brief introduction to backscattering measurements
- Browser-based user interface for Pica
- OD600 (definition of optical density used in biochemistry)